
The Future Is Connected Retail.
Building the next generation of retail infrastructure.
Physical retail, digital commerce, media and real-time intelligence — one connected platform.
Retail is fragmented.
Consumers expect convenience. Brands expect speed and visibility. Traditional infrastructure keeps the experience disconnected.
Location, inventory and operational complexity.
Online demand rarely meets physical moments of need.
Attention and transactions live in different systems.
Fragmented reporting limits rapid optimisation.
The opportunity is not another channel.
It is connecting the channels.
Imagine if everything worked together.
One platform turns every location into a connected journey.
- Every impressioncan create a purchase opportunity
- Every transactioncan generate useful insight
- Every interactioncan improve the next
That's Connected Retail.

One device.
Four connected channels.
One integrated consumer journey — from attention to transaction to insight.
One device. Four ways to grow.
Reach the audience. Engage in the moment. Convert to commerce. Learn from every interaction.
That’s Connected Retail.
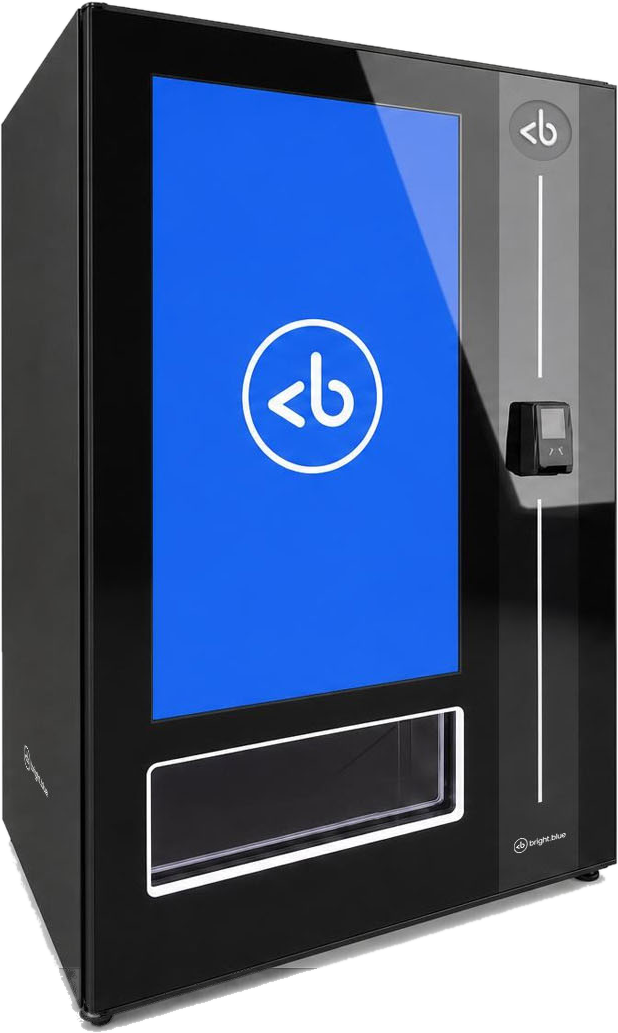
Products at the point of need
Sell beyond the physical shelf
Turn attention into action
Understand what works in real time
Already live. Already scaling.
Real Locations. Real Audiences. Real Revenues.
* Previously management-reported live estate; confirm latest as-of date. † Estimated monthly impressions; validate methodology. ‡ Potential monetisation categories, not all active on each device. TBC = verified data required. Partners shown are relationship examples, not necessarily all live sites.
The technology we own.
A complete, proprietary platform — from hardware to AI, payments and commerce.
Our own smart retail devices, sensors and control systems
Remote device, content, product and performance management
Intelligent experiences, automation and personalised merchandising
Product, stock and compliance monitoring with real-time insights
Audience, sales and campaign performance to drive higher revenue
Create, schedule and measure retail media and brand campaigns at scale
Secure, flexible and global payments (Adyen and partner integrations)
Extend the in-venue experience online — shop, subscribe and fulfil
One platform. Multiple revenue streams.
Recurring, transactional and campaign-based income can coexist across one connected footprint.
Count only Bright.Blue recognised revenue — not total product sales, media spend or partner turnover.

Sales or contractual revenue share
Online transactions originated on-device
Campaigns and advertising inventory
Paid placement and premium visibility
Software and device management fees
Creative, deployment and managed campaigns
Two channels. One connected retail network.
Acquire the venues. Monetise the audience. Grow the value of every connected device.
Secure locations and operator partnerships, then deploy connected retail devices.
Connect brands, agencies and resellers to audiences through retail, media and commerce.
The marketplace monetises the network.
Brands, agencies and resellers access one connected retail network to activate campaigns and products.
List physical or online products, run retail media and measure sales.
Book digital screens, combine media with commerce and track results.
Register opportunities, generate quotations and earn commissions on eligible sales.
Digital screen ads · Physical product sales · Online product sales · Customer acquisition



















More demand. More revenue per device.
As the network grows, more buyers can access more audiences — creating more ways to monetise every connected device.
More venues and screens expand available audience and commercial inventory.
Brands, agencies and resellers bring additional campaigns and products.
Screen media, physical products, online sales and lead generation.
More relevant campaigns and products can improve inventory fill.
Campaign and transaction results can inform future commercial decisions.
Self-service, smarter pricing and AI recommendations can support scale.
AI recommendations, bidding and advanced automation are product roadmap opportunities; not presented as live capabilities.
Built to scale. Difficult to replace.
A multi-layered moat that combines proprietary technology, exclusive venue access and compounding network performance.
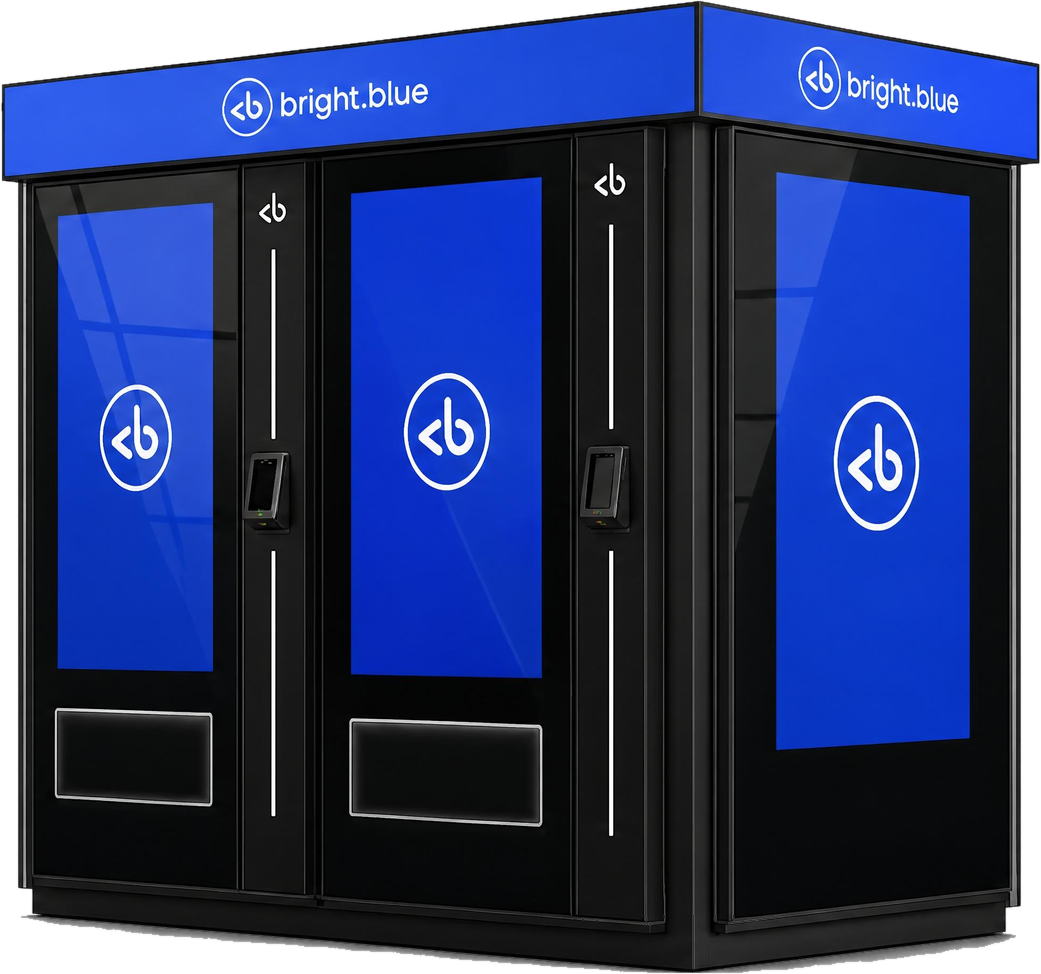
- End-to-end, full-stack IP
- Hardware, software, cloud, AI
- Continuous innovation and control
- Growing estate and venue density
- First-mover advantage in key venues
- Data and performance that improve with scale
- Remote monitoring and AI support
- Field service and partner network
- High uptime and outlet performance
- Long-term contracts with leading brands
- Deep integration into venue operations
- High barriers to entry for new competitors
- Real-time engagement and sales data
- Audience insights and campaign performance
- Drives higher revenue, efficiency and retention
- Retail, eCommerce, media and payments in one platform
- Multiple monetisation streams per device
- Higher revenue and stronger unit economics
Capital-efficient global expansion.
Scale the network through standardisation, partner delivery and centralised operations.
- 01Standardise
Modular devices and documented assembly
- 02Partner build
Distributed assembly and quality controls
- 03Deploy locally
Installation and field service partners
- 04Operate centrally
Remote provisioning, monitoring and support
Financing and contractual terms to be validated
Manages the platform, commercial partnerships, retail media, payments integration and network operations.
* SPV funds and owns the devices, with Bright.Blue operating the network under agreed contracts.
From UK traction to US scale.
1,000+ devices in the UK. Targeting 20,000 devices in the US within 3 years.
Target, subject to financing and execution.
The deployment roadmap to 2030.
A phased, capital-efficient rollout — from 120 deployments in 2026 to 19,385 devices by end-2030.
- 01Partner-led assembly and field deployment
- 02Remote configuration and software activation
- 03Central monitoring, support and optimisation
- 04SPV asset financing – subject to availability
- Transport & Travel
- Retail & Commercial
- Education & Student Living
- Health & Fitness
- Residential & Corporate
- Hospitality & Leisure
- Sports & Large Venues
- Miscellaneous
SOURCE: Bright.Blue OpCo Deployment Forecast, version 22 Sep 2025. Capacity ramp is a plan, not a committed deployment schedule.
Building the 2027 Deployment Pipeline.
Advanced commercial opportunities across the UK and US, progressing towards contracted and funded deployments.
Targeted for deployment in 2027
- UK438(17%)
- US2,175(83%)
ILLUSTRATIVE PLANNING PLACEHOLDERS — device allocation, commercial status and timing are unverified; not contracted backlog.
We Earn When We Deploy. We Earn More as We Monetise.
Two complementary profit engines: one-time deployment revenue and ongoing, multi-stream monetisation.
One-time gross profit when Bright.Blue sells a device to the SPV.
Ongoing gross profit from physical retail, online commerce, media, listings and data.
| METRIC | ONE-TIME (DEPLOYMENT) | ONGOING (MONTHLY) |
|---|---|---|
| Revenue | $20,000 | $6,080 |
| Gross profit | $6,000 | $2,200 |
| Gross margin | 30% | 36.2% |
| Annualised gross profit | — | $26,400 |
- Physical products$3,143(51.7%)
- Retail media & DOOH$1,562(25.7%)
- Listing fees$625(10.3%)
- Online products$548(9.0%)
- Data & analytics$201(3.3%)
Illustrative mature-device economics, not current estate performance. The $20,000 device sale revenue and 30% hardware gross margin are based on the SPV purchase price and assumed margin. Ongoing revenue mix and margins are illustrative and may vary by venue, market and product mix.
From proven momentum to global scale.
Actual performance (last 6 months) and the plan to 2030.
ILLUSTRATIVE DESIGN ONLY — SIX MONTHLY “ACTUALS” ARE PLACEHOLDERS. REPLACE WITH VERIFIED FIGURES BEFORE INVESTOR USE.
Scaling revenue. Building profitability.
2026–2030 management forecast — accelerating revenue growth with attractive projected margins.
ILLUSTRATIVE CATEGORY VALUES — $291m ONE-TIME AND $160m TRANSACTIONAL GP ARE NOT VERIFIED. RECONCILE TO FORECAST BEFORE INVESTOR USE.
SOURCE: Bright.Blue OpCo Deployment Forecast, 22 Sep 2026.
Illustrative management forecast, not actual trading. Gross margins are before overheads, financing and non-operating items.
Multiple revenue streams. Attractive margins.
2026–2030 projected revenue and gross margin by category — with individual stream economics clearly identified.
Overall forecast gross margin: 35.3% ($969m gross profit / $2.74bn revenue). Individual stream margins TBC pending model detail; no stream-level rates inferred.
SOURCE: Bright.Blue OpCo Deployment Forecast, version 22 Sep 2026. Illustrative projections unless otherwise stated. MODEL FORECAST / USD
Valuation framework. A platform with multiple drivers.
A market-based approach using relevant technology comparables and an EBITDA-multiple sensitivity analysis.
- Payments technology5.5×–14.0×
- Retail technology(POS / commerce)~10.5×
- Software(SaaS)~24.5×
- Data(Information services)~11.5×
- Hardware(Equipment / IoT)~8.6×
- AI-enabled platformn/a(no consistent premium)
A connected commerce platform combining payments, retail, software, data, AI and hardware, with high recurring revenue and margins.
| Adjusted EBITDA | 8× | 10× | 12× | 14× | 16× |
|---|---|---|---|---|---|
| $25m | $200m | $250m | $300m | $350m | $400m |
| $50m | $400m | $500m | $600m | $700m | $800m |
| $100m | $800m | $1.0bn | $1.2bn | $1.4bn | $1.6bn |
Central discussion case, with 8× – 16× as the main range and 18× as an upside scenario with further scale and recurring earnings visibility.
- Recurring earningsGrowing, high-margin, repeatable revenue from an installed base.
- Multiple revenue streamsRetail, media, payments, data and software on one platform.
- Scalable and capital efficientSPV model, partner assembly and remote operations.
- Execution and visibilityContracted rollouts, live estates and clear growth pipeline.
Sources: Public market comparables (selected: payments, retail tech, software, data and hardware). Multiples are indicative and for reference only, not a Bright.Blue valuation.
Capital-Efficient Growth. Funded by SPVs.
Bright.Blue deploys and monetises the network while third-party SPVs finance device ownership.
Bright.BlueSupplies the technology, deploys and operates the platform- Scalable to 20,000+ devices
- Limited balance sheet use
- Recurring, high-margin revenue
- Aligned, long-term SPV structure
A larger, faster network with strong, recurring returns and efficient use of capital.
The team behind Bright.Blue.
Experienced leadership across technology, finance, commercial growth and operations.

- Mercedes-Benz · Volkswagen Group · TUI
- Founder & CEO, Digitech
- Built connected-commerce technology across global markets
- Career highlights to be added
- Career highlights to be added
- Career highlights to be added
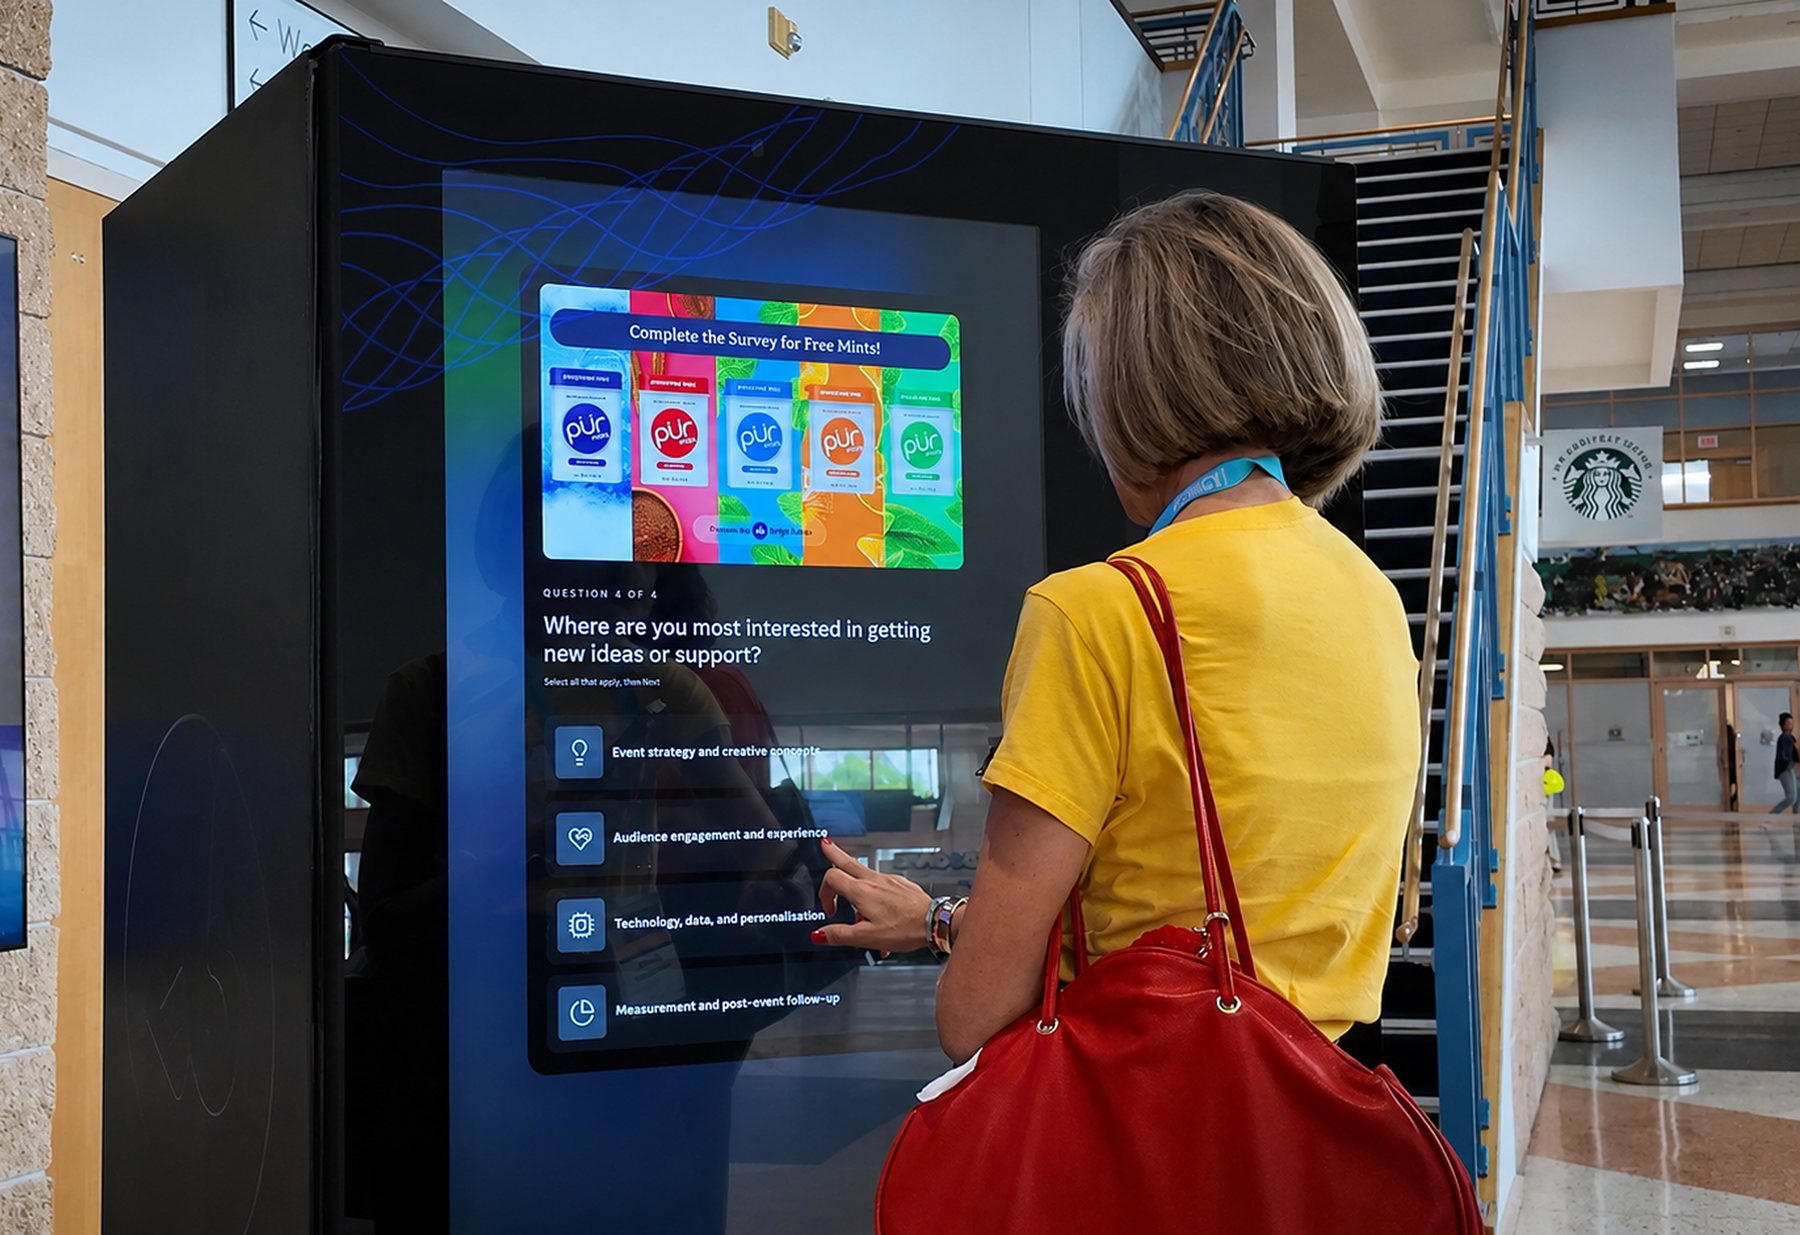
Why Bright.Blue. Why Now.
An operating connected-commerce platform with multiple monetisation paths and a capital-efficient route to global scale.
- 01Proven operating platformLive UK network and commercial activity
- 02Vertically integrated technologyDevices, electronics, cloud, payments, AI and media
- 03Multiple revenue streamsTransactional, recurring and advertising income
- 04Capital-efficient expansionSPV-funded device ownership, subject to financing
- 05High-margin revenue opportunitySoftware, media, listings and data monetisation
- 06Significant global growth potentialUK operating base and staged US expansion
- 07Experienced leadershipEnterprise technology and international operations
- 08Operating leverage & scalable deliveryPartner assembly, remote deployment, AI-enabled support and centralised operations
One platform. Multiple revenue streams. Capital-efficient global scale.
All three headline metrics are management projections, not historical results. Growth depends on execution, financing and market conditions.